I recently surveyed 385 young librarians on Facebook about their job-seeking experience, and reviewed the initial results here. In this post, I’d like to reflect on what I learned about online survey methods and cleaning data, before going on to discuss results in more detail in my post on using Excel.
Survey Methods: Using the SurveyGizmo Software
First, I used SurveyGizmo for this. Right now they have a free basic account, and offer 50% off any other level of account for current students, or 25% off for teachers/nonprofits.
To be honest, I like SurveyGizmo because I have a pretty sweet legacy account, and I’ve worked with it on a number of prior projects. If you’re a library student or academic librarian, you may well have an institutional subscription to Qualtrics or something more comprehensive, so ask around to see if you can use full-featured software for free, or share your favorite free option in the comments below!
Survey Methods: Check the Mobile View
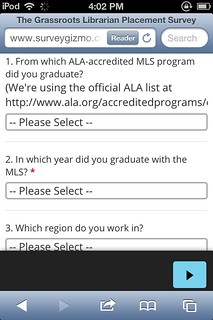
One thing I regret is that I didn’t try out the mobile version before going live. SurveyGizmo has a responsive design that looks good on a smartphone, and I assumed that would be fine. But when I pulled up the survey after 1/4 of people had already responded, I realized that:
- The intro text was way too long in mobile view.
- It was hard to type or tick boxes in mobile view, and
- The next-page arrow wasn’t labeled on the theme I’d chosen.
About 1/3 of respondents only finished the first page of the survey, and I suspect that’s because it was just too much work to keep going. Next time, I’ll keep things as brief and clickable as possible for mobile readers.
Survey Methods: Ethics for Citizen Surveys and Data Exploration
If you aren’t an academic, you may not know that scientific researchers typically have to go through an ‘Institutional Review Board’ in order to get approval for any scientific research on people. I’ve gotten IRB before for school projects, but I threw this survey up over a weekend and didn’t apply for IRB, because I knew it wasn’t a scientific project. Honestly, I still have mixed feelings about this:
- On the one hand, ethics approval is good: it makes you think more carefully about your work and ensures that you’re looking out for the people you collect data from. Bonus: educated white folk seem to magically trust anyone who requests personal details after handing them an informed consent form == a lot of social trust going on.
- Yet on the other hand, this wasn’t a scientific or academic project, and it didn’t need to be. It was curiosity-based, with no lit review, no sampling frame, no cross-checked survey design. It wouldn’t be fair to pretend that “polling colleagues on Facebook” is somehow reliable research, to publish it in peer-reviewed journals, or to ask a university to endorse it. Is that a justification? I’m not sure, but I also don’t think that we can limit human exploration to academics only.
Citizen Peer Review of Ethics?
I consider this curiosity-meets-internet-data-tools, and honestly, I’d like to see it expand. I believe in citizen journalism, in a world where bloggers, small businesses, and citizens can collect data just as much as corporations and governments do. But ethics remain important, and it would be great to have a way where people can evaluate non-scholarly online research. Offhand, I’d propose ethical standards for citizen data explorers of:
- collecting only the data we need,
- being clear about why we’re collecting data and how we’ll use it,
- securing the data with a good data management plan,
- ensuring the data is not being used to harm any individual, and
- using data responsibly once we’ve got it.
Is there a way that ordinary people could review each other on data collection, maybe rating ethical and methodological quality of the work on an A-F scale? The internet should totally make this possible, and it would be valuable going forward.
Survey Methods: Looking at the Data
Making a survey is easy. Drawing a good sample and doing a decent analysis is harder. When I pulled down the data in Excel, I realized a couple of things:
- Survey completion: some people fill in every box, and others go a short ways before stopping. Comparing results becomes difficult.
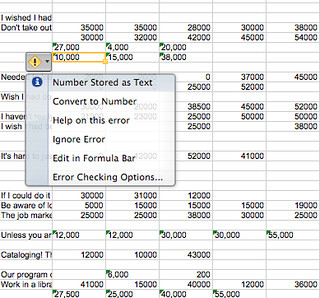
- Inconsistent numbers: The salary data arrived as 24,000, $24,000, and 24000. I had to manually remove $ and , characters to compare results.

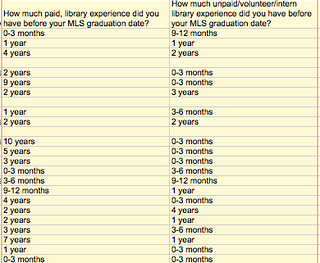
- Category data. I asked people about length of time using a drop-down list of 0-3 months, 3-6 months, and so forth. It was great for respondents, because they could answer easily… but it’s a beast for me to analyze! I may need to separate out quarters and years in evaluating time spent in LIS work, and because the timescale is unequal, I can’t really stack them up for numeric analysis. Next time, I would chose even intervals, at the least.
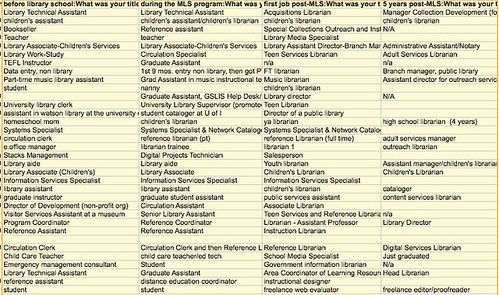
- Non-numeric data: I also have 200+ answers for job title before, during, and after the MLS, as well as for strengths and weaknesses in our library school experiences. I really appreciate that people took the time to write textual answers, but it will be a challenge to analyze! I’ll likely use Atlas.ti or NVIVO for that. I’ve also been wondering if #hashtags could be used for in-line text coding.
- Multi-select: One final weirdness that I’m not quite sure what to do with is multi-select boxes. Respondents to this survey were sometimes frustrated with questions where I forced them to choose among radio buttons (“pick one”) rather than creating multi-select boxes (“check all that apply”). However, multi-select boxes are much harder to analyze! They end up scattered in multiple columns; they don’t total 100% and so you can’t sum them up in a pie chart, etc. I’ll look at ways of importing these into statistical software (E.g. “1” for “Working full-time in a library, in a post-MLS role” and “0” for not having ticked that box), but for now it’s a bit of a pain!

In sum, these are a few of the challenges I encountered in creating this survey; I’m listing them briefly here just so that people curious about the background to survey creation have a reference point!


