
It’s a snowy weekend as I draft this with a cup of hot cocoa in hand 🙂 I went over my survey of 385 young librarians before, as well as critiqued my own methods. In this post, I’ll try working with Excel data. Please bear in mind that a) I’m blogging my own learning curve, and would love your feedback, and b) I got responses from only 1% of the 40,000+ MLS graduates in the past ten years alone. This all points to a need for more discussion, and more people exploring the data 🙂
Working in Excel: Cleaning the Data
I’m going to work with the 2014 Recent MLS Grads survey, so I hope you’ve reviewed the basic results and survey methods. If you haven’t run numbers in Excel before, do pause and read School of Data’s intro to data in Excel, or better yet, the Data Journalism Handbook.
Should we be running data in Excel? Well, it’s clunky compared to other statistical tools, as Eva Goldwater at UMass points out: it takes a lot of time, doesn’t like missing values, only lets you do simple stuff, and limits how you can re-arrange and visualize data. But on the plus side, you’ve probably used it, and can find a computer that runs it easily.
![The Glamorous Life of a Zine Librarian [59/365]](https://farm4.staticflickr.com/3716/12848763685_cfac77487d.jpg)
Descriptive Statistics in Excel: Librarian Salaries
You’ll see below that I asked individuals to report their salary a) before library school, b) during library school, c) 6 months after, d) 2 years after, and e) 5 years after MLS graduation. To get these numbers, I cleaned up punctation from the numeric data. By looking at the raw data, I noted that some responses seem to be typing errors (an annual salary of $430,000? Was that $43,000… or am I working in the wrong library?).
For descriptive statistics, I copied non-$0 salary data on a new page, then ran descriptive statistics on each column (data tab –> descriptive stats). What you see took a half hour of fiddling to produce. I’m suspicious of how outliers may have impacted the results, even using the median, but I like the detailed statistics produced:

Above, then, we see a median wage of $22,900 before grad school, $18,000 during school, $35,000 six months after graduation, $40,000 two years after, and $47,000 five years after. Note that the ‘count’ of responses drops after two years out, due to the recent grads, and also that these statistics only include those who had a non-zero salary. Including unemployed folk in the totals would make it a bit lower!
Descriptive Statistics in Excel: Cost of the MLS and Student Loans
I also wanted to check what people paid for the MLS, and how many loans they took out. As I pointed out, the auto-charts were terrible, as punctuation threw off the totals. Here I also suspect that numbers like $400,000 are errors; if I asked about dollar values again, I’d limited permissible answers to a $1000-$200000 range.
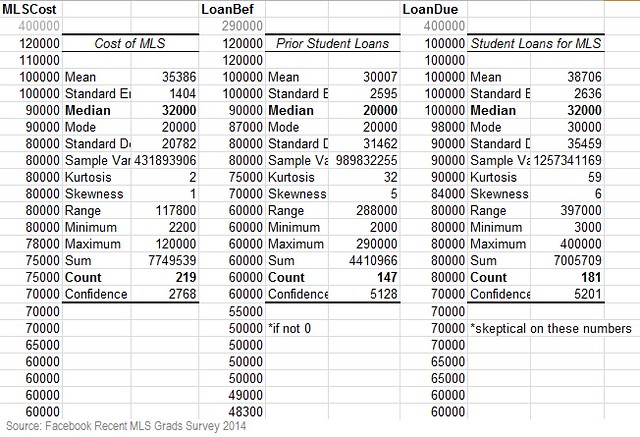
*Note in the latter two columns, loan averages only include the 60% of grads with prior debt, and the 72% of grads with MLS debt. I’ve excluded the 30-40% of MLS grads who had no student loans, the lucky ducks!
Above, we see graduates reporting a median $32K cost of MLS. This seems reasonable, given advertised costs. For those who had loans, graduates took out a median $20K in loans prior to the MLS, and a median $32K in loans for the MLS. Perhaps the MLS loan number is higher than the partial loans I would expect, due to living expenses.
Using the Data Journalism Handbook for Excel
Descriptive statistics are great for a single column, but pivot tables can help compare various groups. Again, check the Data Journalism Handbook if you haven’t used pivot tables before! It’s easier to get averages, and the numbers below all include 0-answers. On the downside, it gives us a mean, not a median. Pivot:
| Before MLS | During MLS | 6 Mo. After | 2 Years After | 5 Years After |
| $ 23,566 | $ 18,862 | $ 31,162 | $ 39,035 | $ 47,184 |
Pivot table means skew the cost of MLS upwards, while they bring loan costs down, as we include the 30-40% of people who took no loans at all:
| Mean Cost of MLS | Mean Loans Before MLS | Mean Loans for MLS |
| $ 35,588 | $ 17,366 | $ 27,582 |
Aside: Should You Take Out Loans for the MLS?
I’m concerned by the high figures like $50,000 for an MLS, for reasons that BeerBrarian has already outlined: some of us take out more debt that starting salaries can possibly support. If you make the average $39,035 two years after your MLS degree, Mapping Your Future recommends taking on no more than $22,600 in student loans. Undergrad or MLS loans. Total. And that’s if you get a starting job at or above the average, which many of us will not. I wish you all the best, but do think carefully, and choose a school or scholarship that’s most cost-effective. Minimizing debt will free you up to get the experiences you need after the MLS!
Excel Pivot Tables: Breaking it Down
In the results above, the average $31,000 at six months after MLS doesn’t tell us much. Below is a salary of graduation year versus average starting salary for people in any position:
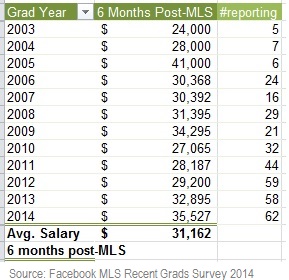
Not terribly useful. Next, I compared region to months spent searching for a full-time job, because I was curious if there were regional differences. Folk in the western US spent more time searching, on average:

I also took a look at librarians’ self-reported class, by age at MLS:
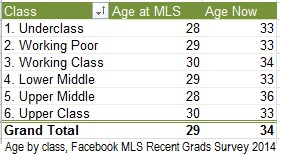
However, I can’t see any trends, and Excel won’t let me run box plots based on a pivot table (lame!). What I can do is pull out minimum, maximum, average, and number of people responding who identify with each social class in America:
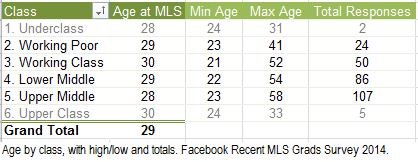
Note that people growing up in more affluent households may be more likely to take on an MLS later in life. Because the MLS doesn’t offer a high financial return on investment, it’s somewhat of a luxury degree for those in the lower classes.
Grouping Responses in an Excel Pivot Table
One final chart. I made the next chart using this guide on how to group ages together. I’d seen in browsing the raw data that some librarians had low salaries before the MLS ($5,000 a year, anyone?). Others left high salaries behind ($50,000 before MLS?), then graduated making less than they started with! I suspected age was a factor here:
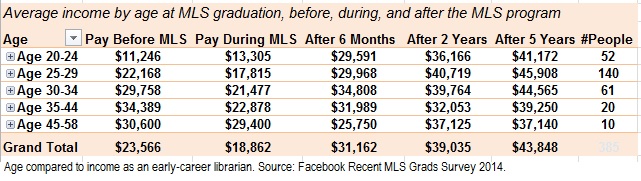
I grouped ages to keep reasonable numbers of respondents in each group. Age does seem to relate to income in this sample, perhaps because non-library work experience can still affect your starting salary. In general:
- Younger folk may have lower pay before and during the MLS. As we all know, it’s hard to get started in today’s workforce.
- Doing the MLS at age 25-34 may be related to higher earnings after MLS, perhaps because mid-career folk have better experience starting out, but are still young enough that their careers continue upwards five years out.
- Older grads with prior work experience are most likely to lose income because of the MLS, perhaps because they’re making a major career change.
I see these numbers as positive on the whole: we don’t step into high salaries just after graduation, but whether or not you end up in a library job, your salary should even out after five years. I’ll continue running numbers, and next I hope to work with the data in SPSS. Do let me know if there are ideas you’d like me to test on these survey results, below!
Pingback: Excel Roundup 20141215 « Contextures Blog