
Google loves data. I’ve reviewed Google nGrams before; built on top of their massive project to scan published books, it’s a way to study how our written culture changes over time. Below, I’ll cover a few more interesting tools, which I hope will be fun for you to play around with:
1. Find what everyone’s searching for with google trends
As I found out when working as a data janitor for an online content producer, people write the funniest google searches about everything from worrying stigmata to their pet hamster. But how do I know what’s important to lots of people?
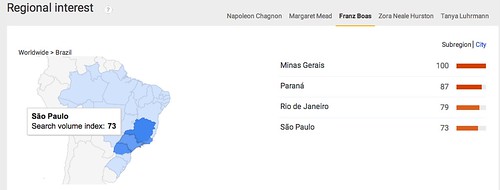
One way is to search Google Trends. For instance, say I’d like to know who searches for classic anthropologists like Margaret Mead, Franz Boas, and Zora Neale Hurston vs more recent ones like Napoleon Chagnon with his controversial book, and Tanya Luhrmann with her consistently insightful research on our culture and minds.
Typing their names into Google Trends, I’ll see how frequently people search for them, across time and place (CoSchedule explains this some more). For instance, Franz Boas is way more popular than other anthropologists in urban Brazil:
I can also download data about their popularity to Excel, sort it, then upload to infogr.am as a basic infographic:
Easy enough, but there’s a lot more to explore. Google has used this tool to track the spread of dengue fever and the flu, which they currently rate as “intense” here in Maine.
Author Seth Stephens-Davidowitz used Trends to see whether parents are more concerned about brilliant sons or daughters, as well as to how many wives suspect their husbands are in the closet (ouch!).
So take a look. It’s a fun way to explore culture and what we’re interested in, looking for, or worried about. And with the tools below, it could also help you in writing what your readers are actually searching for:
2. Keep an eye on popular blog topics with google keywords
Google wants us all buying ads on their search engine–that’s their profit model–so you can use another tool to play with keywords. Just type in a word under ‘new keyword and ad group ideas’:
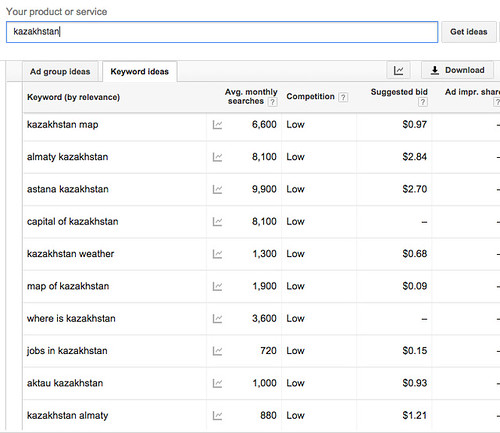
The search for “Kazakhstan,” above, tells me that lots of people search each month for the cities of Almaty (Soviet capital), Astana (current capital), and Aktau (oil capital)… as well as ask more basic questions like ‘where is Kazakhstan?’
.svg#filelinks)
(Answer: … only in the middle of our world’s biggest continent). Or take another example–the Kazakh fashion for fur coats and high heels:
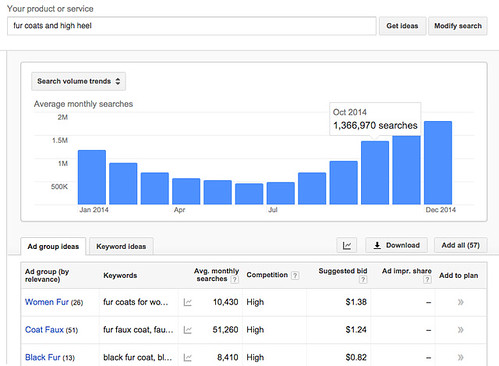
More people search for fur coats in the winter… who knew? Anyway, playing with the settings, I can see what you’re searching for in different countries and cities, and how much ‘competition’ there is for your searching eyeballs. This is a good way to inform your research focus, your blog posts, your library services, your brilliant website ideas, etc etc:
2. Find Spurious Searches With Google Correlate
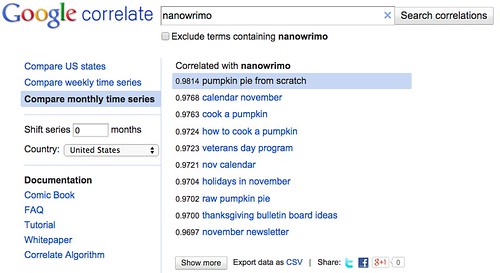
Another fun tool is Google Correlate, which uses a Pearson correlation coefficient (r) to find searches occuring in proximity to each other. To understand the numbers, just know that the closer R is to 1.0, the more two things are correlated in our collective search history… which Google has stored weekly since 2003. The closer to -1.0, the more negatively correlated (one goes up when the other goes down), and the closer to 0.0, the less there’s any type of tie between two searches.
Time: For instance, I can compare words over time. Here, those who search for November’s nanowrimo novel-writing contest also search for… pumpkin pie, among other autumn-themed searches.
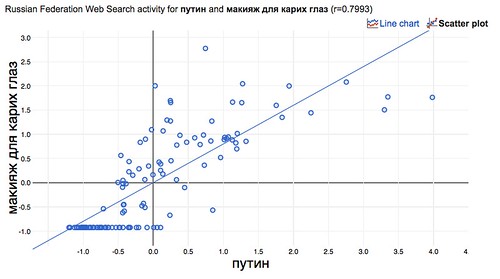
Not a surprise. I could also look internationally, keeping in mind that many Russians use Yandex instead of Google. Below, searches for Putin are correlated with searches for “makeup for brown eyes.” I… I have no idea how this was determined:
 Place: And instead of looking at searches by country, month, or week, I can also look at the frequency of connected searches by state. For instance, apparently cookie walks are popular in the upper Midwest. The correlation between searches for “cookie walks” and searches for “wrestling live stream” is strongest in Iowa:

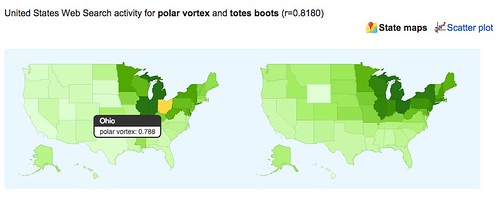
I assume this means that a) women are making cookies while men are watching wrestling or b) watching wrestling makes you hungry…? Again below, maps show where searches for the “polar vortex” are most correlated with searches for “totes boots”–the darker the state, the stronger the correlation:
I don’t fully understand these tools, but they seem like one useful thing to play around with. So check out Google Trends for popular search terms (as a frequency of total terms), Google Keywords for hard numbers on our searches, and Google Correlate for rather fanciful correlations. And if you have other tools for understanding the web, feel free to let us know in the comments!